IELTS Task 1 Writing Samples
On this page are IELTS writing task 1 samples that have been submitted by actual IELTS candidates who are preparing for the test.
Below each IELTS sample writing are comments on the writing so you can see the strong and weak points of each piece of writing.
This is useful as a guide to help you in preparation for the test.
The IELTS task 1 writing samples have also been listed on the right hand side of the page so you can easily find a particular type of graph you may be looking for.
Please note that the essays submitted on these pages were checked in the past. Due to time constraints, I am not able to check any at the moment so please don't submit any to the site.
Sorry and thanks.
You can read more graphs, charts and tables written by students here in the IELTS Forum:
Student Sample Graphs:
Click below to see sample graphs from students.
Below each answer you can leave your own comments or ask a question if you have one.

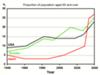
Sample IELTS Task 1 Line Graph:
Proportion of Elderly 
The graph illustrate the comparison between three different countries USA, Sweed, and Japan in elderly. Overall, the proportion of three countries going …
IELTS Task 1 Writing: Bar Chart
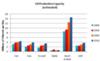
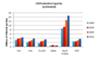
Oil Production Capacity
The graph compares changes in the Oil Production Capacity in millions of barrels per day in six countries.
Overall, it is clear that oil production …

IELTS Task 1 Writing: Line Graph
Unemployment Rates in Japan and USA
The line compares changes in the percentage of people who were unemployed in the USA and Japan over a period of 6 years from 1993 to 1999
Overall, the …
Task 1 IELTS Sample:
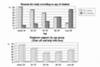
Reasons for study and employer support
The bar chart illustrates the reasons why people study and the second chart shows the level of support given by their employer according to different …
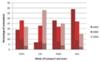
Task 1 Bar Graph Over Time:
Modes of Transport
The bar graph changes in the transports used to and from work in a particular European city for three years.
Overall the chart indicates that car …
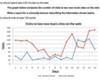
IELTS Sample Task 1 Line Graph:
Visits to two new music sites on the web
The line graph delineates information in comparison to the number of visits to two new music sites on the web.
On day 1, one can favourably notice that …
Sample IELTS Task 1 Line Graph: Proportion of Elderly People
Summarise the information by selecting and reporting the main feature and make comparisons where relevant.
You should write at least 150 words.
…
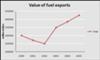
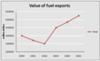
Task 1 Sample Answer: Value of Exports
These following graphs indicate the value of food, fuel, manufactured goods and the total value of exports sold overseas by one country between 2000 and …

IELTS Sample Task 1: Travel to and from Work
Write a report for a university lecturer describing the information below.
· You should write at least 150 words.
· You should spend about 20 minutes …
Task 1 General Training:
Semi-Formal Letter
Request to Employer
Semiformal letter:
You are working in a company. You would like to join a training course related to your work. Write a letter to your employer, in …
Task 1 General Training:
Informal letter to a friend - Invitation
A friend who lives in another country has invited to you come and stay with him/her on your next holiday. You are too busy to accept the invitation.
…
Task 1 General Training:
Formal Complaint Letter
You travelled by plane last week and your suitcase was lost. You have still heard nothing from the airline company.
Write to the airline and explain …
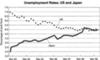
Task 1: Line Graph - Unemployment in US and Japan
The line graph compares figures for unemployment in America ad Japan over a period of six years.
Overall, the unemplyment rate was higher in Japan,compared …
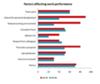
Task 1 Bar Chart: Effectiveness at Work
The graph illustrates the information about the factors that affect the work effective of workers in a company. Workers are divided into two groups depending …
Task 1 Table: IELTS Results
The graph illustrates the ielts results of candidates from some language groups during 2003. As can be seen from the graph, all numbers ranged from 6 to …
IELTS Line Graph - Money Spent on Books 
The line graph elucidates information on the money spent on buying books in the four various countries-Germany, France, Italy and Austria-for 10 years …
IELTS Sample Task 1:
Value of Exports
The graphs indicate the value of food, fuel, manufactured goods and the total value of exports sold overseas by one country between 2000 and 2005.
Regardless …
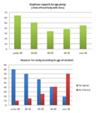
Task 1 Bar Chart: Reasons for Studying and Levels of Support
The first chart gives information about the purpose for study among various age group students,while the second chart shows help given by employers to …
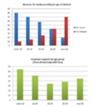
Task 1: Bar Chart
Reasons for Studying
The first graph shows that there is a gradual decrease in study for career reasons with age. Nearly 80% of students under 26 years, study for their career. …
IELTS Task 1 Writing: Line Graph
Oil Production Capacity Not rated yet
The bar graph illustrates the amount of oil produced in million barrels per day in six given countries from 1990 and 2010.
It can be seen that oil …

Task 1: Line Graph - Value of Exports Not rated yet
The graph below shows the total value of exports and the value of fuel, food and manufactured goods exported by one country from 2000 to 2005.
Summarize …
Academic Task 1:
Student Sample Writing:
Student Sample 1
Proportion of Elderly
Line Graph
Student Sample 2
Visits to Internet Music Sites
Line Graph
Student Sample 3
Unemployment
Line Graph
Student Sample 4
Effectiveness at work
Bar Chart
Student Sample 5
Study
Bar Chart
Student Sample 6
IELTS Results
Table
Student Sample 7
Reasons for Study
Bar Chart
Student Sample 8
Value of Exports
Line Graph
Student Sample 9
Value of Exports
Line Graph
Student Sample 10
Modes of Transport
Bar Chart
Student Sample 11
Travel to Work
Bar Chart
Student Sample 12
Value of Exports
Line Graph
Student Sample 13
Oil Production Capacity
Bar Chart
Student Sample 14
Unemployment
Line Graph
General Training Task 1:
Student Sample Writing:
Student Sample 1
Lost Luggage
Formal Complaint Letter
Student Sample 2
Declining an Invitation
Informal Letter to a Friend
Student Sample 3
Permission to do a training course
Semi-formal Request Letter
New! Comments
Any questions or comments about this page or about IELTS?Post your comment here.