Task 1 IELTS Sample:
Reasons for study and employer support

by dravid
(thailand )
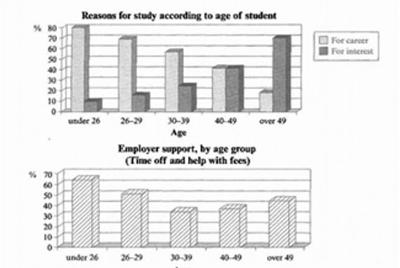
The charts show the main reasons for study among students of different age groups and the amount of support they received from employers.

The charts show the main reasons for study among students of different age groups and the amount of support they received from employers.

The bar chart illustrates the reasons why people study and the second chart shows the level of support given by their employer according to different age group


Overall, it can be seen that more people are keen on studying to building their careers, even though it tends to decline as they grow up. It can be also seen that employers support is maximum for those who are under 29.

70% 80% of students below 26 study to build their careers and this figure tends to decline as they grow older, dropping to 70% for the ages 26-29, 40% for the ages 40 -49, and finally dropping falling to about 20% when people are over 49. By contrast, studying for interest increases from ages to ages over the age groups, rising from nearly 10% to a dramatic peak (70%) where when people finally reach above 49

Moving on to the next chart, it is crystal clear that employer support is very high when people are above 26 years of age. Unfortunately, this figure drops to 50% for the ages (26-29) and finally little over 30%(30-39). However, there is tendency to increase in receiving employers’ support for the next two age profiles.

==================================================

IELTS buddy
Feedback

Corrected Version:


The first bar chart illustrates the reasons why people study and the second chart shows the level of support given by their employer according to different age groups.

Overall, it can be seen that more people are keen on studying to building build their careers, even though it tends to decline as they grow up. It can be also seen that employers support is maximum for those who are under 26.

70% 80% of students below 26 study to build their careers and this figure tends to decline as they grow older, dropping to 70% for the ages 26-29, 40% for the ages 40 -49, and finally dropping to about 20% when people are over 49. By contrast, studying for interest increases from ages to ages over the age groups, rising from nearly 10% to a dramatic peak (70%) where when people finally reach above 49.

Moving on to the next chart, it is crystal very clear that employer support is very high when people are above 26 years of age. Unfortunately, this figure drops to 50% for the ages 26-29, and finally a little over 30% for the 30-39 age group. However, there is tendency to increase in receiving employers’ support for the next two age profiles.

COMMENTS


Overall it's a good answer as your response is easy to follow and you decribe and contrast the key data. You also have some good complex sentences in there. Just a few things to note:

Look at the data on the graph carefully - you make a few mistakes with incorrect data taken from the graph. This may affect your score.

crystal clear = this is too informal for academic writing

Careful how you use brackets:

dropping to 70% for the ages ( 26-29), 40% for the ages (40 -49),

Unfortunately, this figure drops to 50% for the ages (26-29) and finally a little over 30% (30-39).

These need to be a part of the sentence.

Try to vary your language - you say 'drop' three times, which is why I changed one to 'fall'


Return to Sample IELTS Task 1 Writing

Comments for Task 1 IELTS Sample:
Reasons for study and employer support

Average Rating starstarstarstarstar

Click here to add your own comments

Jun 05, 2013
Rating
starstarstarstarstar
my version
by: Sunny

The first bar chart shows how changing the number of the people getting education depending on their age and the purposes of learning. There are clear differences between two particular causes for learning: it is a career and interest.
The second bar chart illustrates amount (in percentage) of incentives providing by the work givers to the varied age categories of workers.

From the information was presented in the first picture we can see that the most percent of students in age under 26 are learning to make a good career - it is in average 80 %. By contrust, pupils, who are educated for their interests, constitute only near 10% in the same age. But this situation changes gradually and with the increase of years amount of careerists in education decline significant - little less than 20 percent in age group under 49. Whereas, there is an upward trend in the number of studying for interest in age period under 26 and more. Also, we should notice one important point, when students achieve age of 40-49 years the numbers of studying either for career or for interest become equal.

The second graph is also a bar chart, which demonstrates a employer's supportive measures amplitude in the five age groups. The figures show that the supporting from employers is very high (approximatelly 60 %) when the workers in age under 26. Than it is tend to decrease a twice at the time, when laborers in age 30-39. There is the lowest level of supporting - jnly 30%, however by the age over 49 this point grows slightly just over 40%.


Sep 07, 2016
Rating
starstarstarstarstar
please rate this
by: Anonymous

The first bar chart compares two main reasons for people to study according to their age while later depicts the level of support getting from their employers in each age category.

Overall, it can be seen that though young people study mainly for their career development, interest becomes a more concerning factor for the study as they grow older. And youngers receive the highest employer support.

To begin, 80% of people, who are less than 26 years, cite that career as their main reason for study, which is 8 times higher than those for interest( 10%). However, in 26-29 and 30-39 age categories, this gap lessens as percentages for interest increase to 15 % and 25% while those for career reduce to 70% and 55% respectively.

Interestingly, 40 - 49 age group claims in similar fractions for both ideas at 40%.

In contrast to above, 70% of people over 49 age study for interest,three times higher than those for the career.

Moving to the second bar chart, people below age 29 have the maximum employer support at over 60%. despite this figure drops to 50 % for 26-29 ages and to almost half for 30-39 ages, it increases in next two age categories to become 35% and 42% respectively.

May 01, 2017
Rating
starstarstarstarstar
bar graph
by: Mohammad88

The bar graphs demonstrates how five age groups (<26, 26-29, 30-39, 40-49 and > 49) vary in terms of the causes driving them to study (career & interest) and how much employer support they receive in the form of financial aids & days off.

In general the young age groups, aged less than 39 years, were driven by career purposes for studying and received more employer support than the rest groups who have interest as their main motivation to study.

Regarding the causes behind studying, 80% of those aged less than 26 years, 70% of those aged 26-29 years and 55% of those aged 30-39 were motivated by career reasons to study as compared to only 10, 15 & 25% respectively whose main reason to study was the interest.

Equal percentage of 40% for both causes in the 40-49 group & in contrast to the general trend, the > 49 group showed greater percentage 70% study because there are interested.

The greatest support is directed toward the < 26 year group (60%), while the lowest to the 30-39 group with only 30%.

The rest are, in descending order of frequency, 50% for the 26-29, 40% for > 49 & 35% for 40-49.

Click here to add your own comments

Return to Writing Submissions - Task 1.