IELTS Task 1 Writing: Line Graph
Unemployment Rates in Japan and USA
by simran
(india)

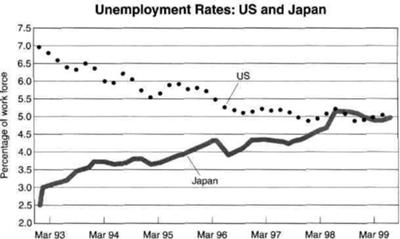
THE GRAPH SHOWS THE UNEMPLOYMENT RATES IN THE US AND JAPAN BETWEEN MARCH 1993 AND MARCH 1999.
The line compares changes in the percentage of people who were unemployed in the USA and Japan over a period of 6 years from 1993 to 1999
Overall, the chart indicates that the proportion of unemployment rates in the USA declined gradually over the period shown. The figures for Japan increased, however.
There were 7% of Americans who were unemployed in march 1993, according to the information available from the chart shown. . The figure for Japan, on the other hand, was noticeably lower, at just 2.5%
Between March 1993 and March 1997, there was changes in the percentage of unemployment rate in the USA , as the figure fell markedly to 5% until about March 1997. Despite some minor fluctuation, the figure remained relatively stable for the next years, ending the final period to about 5%. By contrast during the same period of time , the percentage of unemployment rate in the japan increased gradually for the subsequent years rising to about 4.5% in March 1996, before rising to well above 5% in March 1998. Since then, there was a period of stability in the percentage of unemployment part from a slight fluctuation.
==================================================
IELTS buddy
Feedback
Corrected Version:
The line graph (you can't just say 'the line') compares changes in the percentage of people who were unemployed in the USA and Japan over a period of 6 years from 1993 to 1999.
Overall, the chart indicates that the proportion of unemployment rates in the USA declined gradually over the period shown. The figures for Japan increased, however.
There were 7% of Americans who were unemployed in March 1993, according to the information available from the chart shown. The figure for Japan, on the other hand, was noticeably lower, at just 2.5%
Between March 1993 and March 1997, there were changes in the
Its a good answer overall, but just a few points:
Subject
Be careful with your subject when you describe graphs.
You can talk about the 'percentage of unemployment' or 'unemployment rates' but you can't use both like you do i.e.' the percentage of unemployment rate' (this is wrong).
Percentages and rates are both measurements.
Comparing Data
You do make comparisons of data in your graph which is good, but an important point that you should mention is that they are both equal at the end and follow the same pattern.
This is a key point so you should make specific reference to it.
Comments for IELTS Task 1 Writing: Line Graph
|
||
|
||
|
||
|
||
|
||
|
||
|
||
|
||
|
||
|
||
|
||
|
||
|
||
|
||
|
||
|
||
|
||
|
||
|
||
|
||
|
||
|
||