IELTS Task 1 Writing: Line Graph
Oil Production Capacity
by rama
(india)

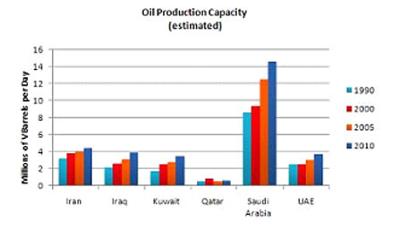
The bar chart shows the oil production capacity of six different countries between 1990 and 2010
The bar graph illustrates the amount of oil produced in million barrels per day in six given countries from 1990 and 2010.
It can be seen that oil production capacities increased over the period shown. Overall, Saudi Arabia had the greatest increases in the amount of oil produced, while Qatar had the lowest producing nation.
Saudi Arabia produced well above 8 million barrels per day in 1990, which is as much as oil produced from the combined production from Iraq, Kuwait and UAE, accounting at nearly 8 million barrels per day. Over the subsequent years, oil production capacities in Saudi Arabia increased dramatically to just above 12 million barrels per day in 2005, and this even rose further to well above 14 million barrels per day by the year 2010. However, compared to Qatar, this country was the lowest oil producing region , under 1 million barrels per day .
Oil outputs in Iran was nearly 3 million barrels per day in 1990, and this rose gradually, reaching little above 4 million barrels per day in 2010. Simultaneously, the figure for Iran increased in twofold, rising from 2 million barrels per day in 1990 to 4 million barrels per day in 2010. oil production capacities in both UAE and Kuwait rose by 2 million barrels of oil in total between 1990 and 2010, although former had a slightly higher figure than latter in 1990.
==================================================
IELTS buddy
Feedback
Corrected Version:
The bar graph illustrates the amount of oil produced in millions of barrels per day in six given countries from 1990
It can be seen that oil production capacities increased over the period shown. Overall, Saudi Arabia had the greatest increases in the amount of oil produced, while Qatar
Saudi Arabia produced well above 8 million barrels per day in 1990, which is as much as
Oil production in the remaining countries was very similar. Oil outputs in Iran were nearly 3 million barrels per day in 1990, and this rose gradually, reaching a little above 4 million barrels per day in 2010. Simultaneously, the figure for
Your answer is fine, though I would make reference more to the similarities of Iran, Iraq, Kuwait, and UAE.
A good answer will clearly highlight key differences and similarities (as you did with Saudi Arabia and Qatar).
You give details about the other countries, but your second paragraph would benefit from a topic sentence explaining how they followed the same pattern (as I added in) to make it clear you area aware of this.
Return to Writing Submissions - Task 1.