Task 1 Sample Answer: Value of Exports

by Puma_andev - Rita Yem
(Shanghai, China)
The graph below shows the total value of exports and the value of fuel, food and manufactured goods exported by one country from 2000 to 2005.

The graph below shows the total value of exports and the value of fuel, food and manufactured goods exported by one country from 2000 to 2005.

The graph below shows the total value of exports and the value of fuel, food and manufactured goods exported by one country from 2000 to 2005.

These following graphs indicate the value of food, fuel, manufactured goods and the total value of exports sold overseas by one country between 2000 and 2005.


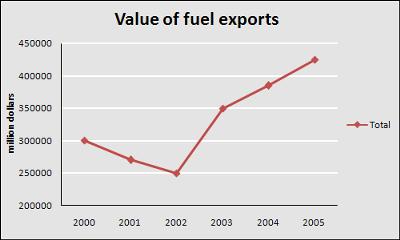
As we can observe the first graph reveals that the total value of exports slightly diminished from 2000 until 2002. However, it sharply escalated in four subsequent years, indicating the total profit of exports at 350000 million dollars position in 2003 and almost 450,000 million dollars in 2005 respectively.

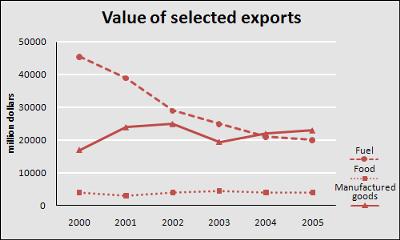
The second graph shows us that the export of food remained nearly the same throughout the period, fluctuating bellow 5,000 million dollars. In comparison to the export of food, the export of fuel and manufactured goods has better showings. The export of fuel was the most valued one amongst others making up 45,000 million dollars in 2000. However, it dwindled noticeably and in 2005 was merely half of that amount. The export of manufactured goods was altering during the time designating less than 20,000 million dollars in 2000 and little more than 20,000 in 2005.

==================================================

IELTS buddy
Corrected Version:


These following The graphs indicate the value of food, fuel, manufactured goods and the total value of exports sold overseas by one country between 2000 and 2005. Overall, the value of food and manufactured good changed little over the period, whereas the value of fuel fell markedly.

As we can observe, the first graph reveals that the total value of exports declined slightly diminished from 2000 until 2002. However, it sharply escalated in the four subsequent years, indicating the showing a total profit of exports at 350000 million dollars position in 2003 and almost 450,000 million dollars in 2005 respectively.

The second graph shows us that the export of food remained nearly the same throughout the period, fluctuating bellow 5,000 million dollars. In comparison to the export of food, the export of fuel and manufactured goods has better showings showed more significant changes. The export of fuel was the most valued one amongst others the three, making up 45,000 million dollars in 2000. However, it dwindled noticeably and in 2005 was merely half of that amount. The export of manufactured goods was altering fluctuated minimally during the time, designating starting at less than 20,000 million dollars in 2000 and finishing at little more than 20,000 in 2005.

FURTHER COMMENTS

Overall it's a good answer as you have some varied sentence structures and you mention all the key information. You also make some good comparisons of each feature, rather than describing each in isolation.

Overview

Make sure you describe the overall general trends at some point in the graph - I've added this to the introduction.

Language of Change

Be careful you are using the right language - you use some which did not work, such as diminishing, altering and disignating.

"Respectively"

You don't have to use the word respectively where did as you are describing one thing. It is used like this:

Exports increased in Italy, France and Spain, by 5%, 7%, and 3% respectively.

Respectively is telling you that the numbers are being shown in the same order as the countries so we know what goes with what.

Comments for Task 1 Sample Answer: Value of Exports

Average Rating starstarstarstarstar

Click here to add your own comments

Mar 21, 2012
Rating
starstarstarstarstar
Thank You for editing
by: Anonymous

I appreciate your help, and I will try to use your tips next time!
What I am concerned about when it comes to writing essays is the word limitation. I always try to stick to the length limit,but is it that necessary?

Thanks a lot)

Mar 22, 2012
Rating
starstarstarstarstar
Task 1 Sample Answer
by: IELTS buddy

Hi,

I think you might have misunderstood about the length. the 150 words for task 1 and 250 words for task 2 are MINIMUMS.

So you can go over those lengths as much as you like. You just should not go under them.

There's no extra credit though for a longer answer (it's quality, not quantity), so you want to write enough to make sure you've answered the question and supported your ideas, but don't write so much that you have to rush and potentially make mistakes.

Thanks

Aug 13, 2013
Rating
starstarstarstarstar
Value of Export, Please help me!!!!
by: Anonymous

The first graph depicts the total value of fuel exports in million dollars for one country between 2000 and 2005. It is evident from the chart that the patterns continuosly varied throughout this time.

At the beginning of period, in 2000, the value total of export accounted 300000 million dollars. Over the next two years, the levels decreased slightly came to 250000 million dollars in 2002. Afterwards, it is can be seen that the levels increased considerably, reached to 400000 million dollars at the end of period.

The second graph shows the value of selected exports. It can clearly be seen that the export of food remained around 5 million dollars throughout the period. Meanwhile, the fuel decreased gradually finishing at 20000 million dollars in 2005. In contrast, the export of manufactured goods fluctuated minimally during this time, starting at less than 20000 million dollars in 2000 and finishing at Little more than 20000 in 2005.


Click here to add your own comments

Return to Writing Submissions - Task 1.