IELTS Sample Task 1:
Value of Exports
by dravid
(thailand )

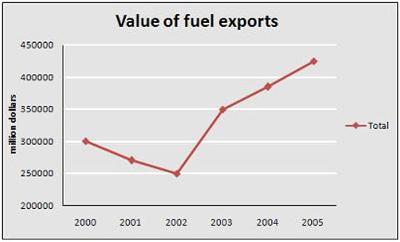
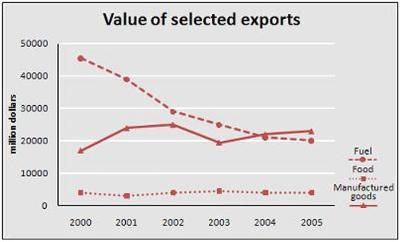
The graph shows the total value of exports and the value of fuel, food and manufactured goods exported by one country from 2000 to 2005.
The graphs indicate the value of food, fuel, manufactured goods and the total value of exports sold overseas by one country between 2000 and 2005.
Regardless of plunge between 2000 and 2002, there was a considerable growth in the value of fuel exported over the four subsequent years, reaching 350000 million dollars in 2003 before pushing the figure further to a new height well above 400000 million dollars by the year 2005.
According to the second chart, nearly 45000 million a worth of fuel was exported, but this number fell significantly and, by 2005, this had fallen to 20000 million dollars. By contrast, export of manufactured goods rose from about 17000 million dollars to 25000 million dollars between 2000 and 2002. Despite a slight fall in 2003, there was a marked upward trend for the next years showing a little more than 20,000 in 2005. In terms of food, this remained relatively stable throughout the period, fluctuating bellow 5,000 million dollars.
==================================================
IELTS buddy
Feedback
Corrected Version:
The graphs
(You need to identify the main trends in the graph here before you go on to your detailed decription - follow this link for more advice on this: How to write an IELTS Task 1 Graph)
According to the second chart, nearly 45000 million worth of fuel was exported, but this number fell significantly and, by 2005, this had fallen to 20000 million dollars. By contrast, export of manufactured goods rose from about 17000 million dollars to 25000 million dollars between 2000 and 2002. Despite a slight fall in 2003, there was a marked upward trend for the next years showing a little more than 20,000 in 2005. In terms of food, this remained relatively stable throughout the period, fluctuating below 5,000 million dollars.
==================================================
As you can see, I have not had to make many corrections to the graph. It's a very good answer, with all the important featuers explained, some comparisons made, and some good grammatical structures.
The only important thing missing is providing an overview of the main trends at the beginning.
Also, do not use this phrase: "pushing the figure"
Thanks
Comments for IELTS Sample Task 1:
|
||
|
||
|
||


