Task 1: Bar Chart
Reasons for Studying
by lion
(Bukhara)
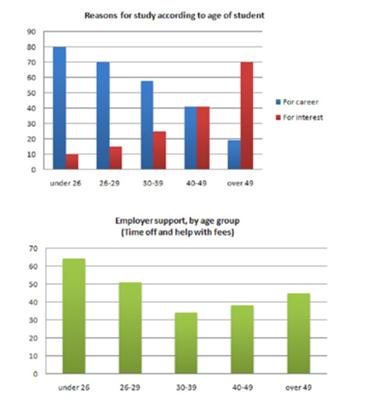
The first graph shows that there is a gradual decrease in study for career reasons with age. Nearly 80% of students under 26 years, study for their career. This percentage gradually declines by 10-20% every decade. Only 40% of 40-49yr olds and 18% of over 49yr olds are studying for career reasons in late adulthood.
Conversely, the first graph also shows that study stemming from interest increases with age. There are only 10% of under 26yr olds studying out of interest. The percentage increases slowly till the beginning of the fourth decade, and increases dramatically in late adulthood. Nearly the same number of 40-49yr olds study for career and interest. However 70% of over 49yr olds study for interest in comparison to 18% studying for career reasons in that age group.
The second graph shows that employer support is maximum (approximately 60%) for the under 26yr students. It drops rapidly to 32% up to the third decade of life, and then increases in late adulthood up to about 44%. It is unclear whether employer support is only for career-focused study, but the highest level is for those students who mainly study for career purposes.
==================================================
IELTS buddy
Feedback
It’s a very good answer with few mistakes, so there is not much I can add to what you have done.
Organization
This is good as you have clearly divided up the information and you have good topic sentences.
vocabulary and grammar
You have some good use of vocabulary e.g. ”late adulthood”.
You have few grammar errors (only one I noticed) and you have some complex sentences in. You could maybe try and fit some more in.
For example, you could do this in your second body paragraph:
Although there are only 10% of under 26yr olds studying out of interest, the percentage increases slowly till the beginning of the fourth decade, and increases dramatically in late adulthood.
However, you do have two important things missing.
1.Introduction
You should have a sentence at the beginning that introduces the graph. For example:
The bar chart shows the reasons why people studied and the level of support given by their employer according to different age groups.
You should use the title of the graph you will be given in the exam to do this. However, DON’T copy it straight from the rubric. You have to put it in your own words.
2.Main Trends
At the beginning, before you go into detail, you should also point out the main trends of the graph. For example:
Overall, it can be seen that most younger people study for career, whilst older people study for interest, and the most support from employers is given to under 26 years olds.
You have done a similar thing with your topic sentence anyway, but it would be a good idea to have an overview in your introduction (or put it in a conclusion) as well.
Follow this link to see examples of graphs and example graph introductions:
Task 1 writing samples
Comments for Task 1: Bar Chart
|
||
|
||