Task 1: Line Graph - Value of Exports
by sohaib


|
|
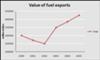
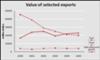
The graph below shows the total value of exports and the value of fuel, food and manufactured goods exported by one country from 2000 to 2005.
Summarize the information by selecting and reporting the main features, and make comparisons where relevant.
The first line graph illustrates figures for total exports by a country,while the second line graph compares figures for selected exports by the same country betwen 2000 and 2005.
Overall,total value of exports increased over this period shown.While the value of fuel export showed a significant decrease,there was a slight increase in the value of manufactured goods exported over a period of five years.
In 2000,value of total exports was 300000 million dollars.It fell in 2002 before rising again in 2003,at about 350000.Finally in 2005,total value of exports peaked at above 400000 million dollars.
The second graph shows that in 2000 the figure for fuel export was highest ,at about 45000 million dollars,whereas the figure for food export was lowest,at under 10000 million dollars.
In 2002,the value of fuel exported fell to 30000 million dolars,while the value of manufactured goods exported rose slightly to about 25000 million dollars.
By 2005,the value of manufactured goods exported were highest among all exports.Over this period of five years,the figures for fuel and goods exports fluctuated,whie the figure for food export remained almost stable,at under 10000 million dollars.
PS:THERE IS A MISTAKE IN THE HEADING OF FIRSTGRAPH.IT IS VALUE OF TOTAL EXPORTS INSTEAD OF VALUE OF FUEL EXPORT
=====================
IELTS Buddy
Feedback:
Here is a corrected version:
The first line graph illustrates figures for total exports by a country, while the second line graph compares figures for selected exports by the same country between 2000 and 2005.
Overall, the total value of exports increased over this period shown. While the value of fuel exports showed a significant decrease, there was a slight increase in the value of manufactured goods exported over a period of five years, and food remained the same.
In 2000, the value of total exports was
300000 million dollars. It fell over the next two years before rising again after 2002, to reach 350,000 in 2003. Finally in 2005, the total value of exports peaked at above 400000 million dollars.
The second graph shows that in 2000 the figure for fuel exports was highest, at about 45000 million dollars, whereas the figure for food exports was lowest, at under 10000 million dollars.
From 2000 to 2002, the value of fuel exported fell to 30000 million dolars, while the value of manufactured goods exported rose slightly to about 25000 million dollars.
By 2005, the value of manufactured goods exported had overtaken that of fuel exports and was the highest among all exports. Meanwhile, the figure for food export remained almost stable, at under 10000 million dollars over the whole period.
========================
Further Commnents:
I added the bit about food as it seems odd to mention 3 of them but not the 4th. Of course in the overview you don’t have to mention everything, you can pick out one most important trend if there is one.
You miss some articles – “the” in a few places (that it just a small point though).
You need to be careful when you write about the changes over time though.
Regarding the first graph, remember to think about ‘periods of time’ – it didn’t fall in ‘2000’ (this is not a period so it can’t change).
It fell from 2000-2002. In 2002 it ‘stood at’ 250,000.
You’ll see I made some other corrections regarding this.
“Over this period of five years,the figures for fuel and goods exports fluctuated,” – this is not right – a fluctuation is when something keeps going up and down – these don’t really do that so I don’t think they can be classed as a ‘fluctuation’.
Overall though, you have quite good organization, you mention all the key things, and have some good grammar. So I think if you just correct your errors when you write about time frames you should do ok.
Return to Writing Submissions - Task 1.