IELTS Sample Task 1 Line Graph:
Visits to two new music sites on the web
by loki
(pacquiao)
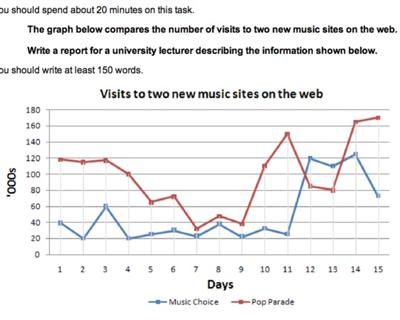
The line graph delineates information in comparison to the number of visits to two new music sites on the web.
On day 1, one can favourably notice that Pop parade outweighs the number of visit of the Music Choice by having 120'000s vs 40'000s. There is a little fluctuation in Pop parade's visit from day 1 to day 3. It descends from day 3 to day 5. Over a period of 2 days only, the number of visit marks half of the number of visit from the first day. A See-saw trend can be seen as well from the 5th day to the 9th. Interestingly, Pop parade's listeners catapulted to almost 150'000s but then again it fluctuated until the 15th day with an accrued 170'000s number of visit.
However, the Music Choice's trend can be described as a roller-coaster ride. From day 1 to day 11, the number of the listeners ranges from 20'000s to 60'000s. Surprisingly, the number of visits rocketed to 120'000s and ends on a downward slope leaving an amount of 70,000s number of visit on the last day.
Based on the facts given, people have this commonality on visiting and enjoying listening to Pop parade music over the Music Choice.
==================================================
IELTS buddy
Feedback
Corrected Version:
The line graph
On day 1,
However, the Music Choice's trend can be described as a roller-coaster ride more eratic. From day 1 to day 11, the number of the listeners ranges from 20'000 to 60'000. Surprisingly, the number of visits rockets to 120'000 and ends on a downward slope leaving an amount of 70,000 number of visits on the last day.
Based on the facts given, people have this commonality on visiting and enjoying listening it is evident that throughout the period people like to visit Pop Parade over the Music Choice.
==================================================
Your answer is good in that it is easy to read and you have clearly divided up the information. There are not too many grammar errors either.
However, as I explain below it would benefit from some more comparison between the two sites.
The Introduction
To describe what the graph shows, you must paraphrase the title. You copy too much here:
...the number of visits to two new music sites on the web.
A few words and short phrases is ok, but this would get deducted from your word count.
You can see in the introduction I have changed it.
Tenses
Careful with your tenses - if you look you'll see you switch between present and past tense. With this graph it is ok to use either, as you are not specifically given a timeframe in the past, but you should choose one and stick with it.
Comparing and Contrasting
A good answer will compare the different data as the question asks you to do. You do compare the visits:
...visits to Pop Parade outweigh the number of visits of Music Choice..
However, the Music Choice's trend can...
However, your answer would benefit from some more direct comparison between the two. For example, pointing out how they started at very different levels at the beginning, they were more similar in the middle, and both increase sharply at the end.
Vocabulary
one can favourably = too personal, keep it 'academic'
See-saw trend /roller-coaster ride = again, these are too informal.
120'000s = 120,000 - no 's'.
Comments for IELTS Sample Task 1 Line Graph:
|
||
|
||
|
||
|
||
|
||
|
||
|
||
|
||
|
||
|
||
|
||