Sample IELTS Bar Graph
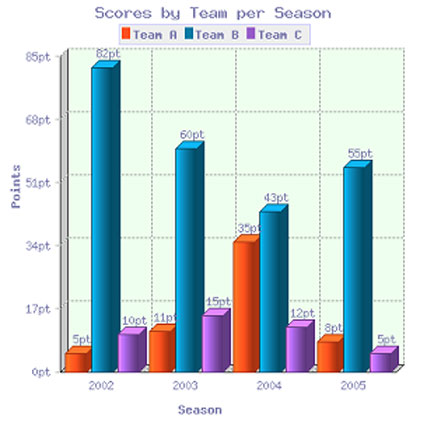
This is a model of an IELTS bar graph. The topic is team scores.
Follow this link to learn more about how to respond to a graph over time.
As with all graphs and charts, you will also need to make sure you are comparing and contrasting the data.
Example 7
You should spend about 20 minutes on this task.
The bar chart shows the scores of teams A, B and C over four different seasons.
Summarize the information by selecting and reporting the main features and make comparisons where relevant.
Write at least 150 words.

IELTS Bar Graph - Model Answer
The bar chart shows the scores of three teams, A, B and C, in four consecutive seasons. It is evident from the chart that team B scored far higher than the other two teams over the seasons, though their score decreased as a whole over the period.
In 2002, the score of team B far exceeded that of the other two teams, standing at 82 points compared to only 10 for team C and a very low 5 for team A. Over the next two years, the points for team B decreased quite considerably, dropping by around half to 43 by 2004.
In contrast, team A’s points had increased by 600% to reach 35 points, nearly equal to team B. Team C, meanwhile, had managed only a small increase over this time. In the final year, team B remained ahead of the others as their points increased again to 55, while team A and C saw their points drop to 8 and 5 respectively.
(Words 164)
Home › Sample Graphs › Sample IELTS Bar Graph
Further Samples:
Model 1
Fast Food Consumption
Line Graph
Model 2
Charity Spending
Pie Chart
Model 3
School Attendance
Table
Model 4
Shopping Mall
Map
Model 5
Brick Manufacturing
Process
Model 6
UK GDP
Bar Chart
Model 7
Team Scores
Bar Chart
Model 8
Electicity Generation
Pie Chart
Model 9
British Emigration
Bar Chart
Model 10
UK Visits
Line & Bar
Model 11
Car Theft
Line Graph
Model 12
Arrests
Pie & Bar
Model 13
Modes of Transport
Bar Chart
Model 14
Living Expenditure
Table
Model 15
Making Chocolate
Process
Model 16
Monthly Expenditure
Bar Chart
Model 17
Tea Manufacture
Process
Model 18
Poverty
Pie & Bar
Model 19
Borrowing Books
Line & Pie
New! Comments
Any questions or comments about this page or about IELTS?Post your comment here.