IELTS Line Graph Examples
Continuing with the sites IELTS line graph examples, this is an example of a line graph comparing car theft.
You should spend about 20 minutes on this task.
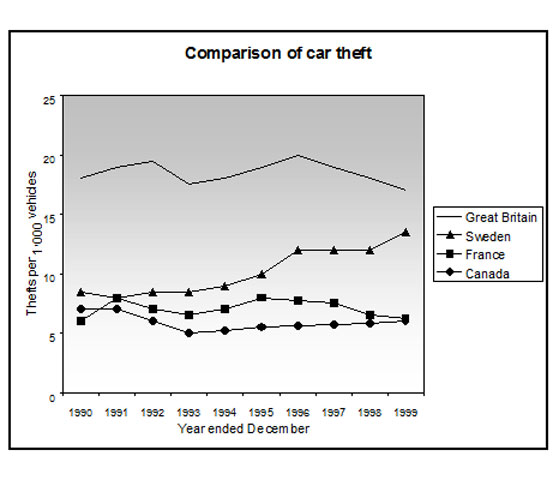
The line graph shows thefts per thousand vehicles in four countries between 1990 and 1999.
Summarize the information by selecting and reporting the main features and make comparisons where relevant.
Write at least 150 words.
IELTS Line Graph Examples - Model Answer
The line graph compares the number of car thefts, measured in thousands, in four countries from 1990 to 1999. Overall, it can be seen that car thefts were far higher in Great Britain than in the other three counties throughout the whole time frame.
To begin, car thefts in Sweden, France and Canada followed a fairly similar pattern over the first five years, all remaining at between 5 and 10 per thousand. The general trend though for France and Canada was a decline in the number of vehicles stolen over the period, with both at around 6 in 1999. In contrast, Sweden experienced an upward trend, starting the period at approximately 8, and finishing at just under 15.
Interestingly, car thefts in Great Britain started at 18 per thousand, which far exceeded that of the other countries. It then fluctuated over the next nine years, reaching a peak of 20 thefts per 1000 in 1996, and ending the period slightly lower than where it began, at approximately 17 per thousand.
(Words 173)
Home › Sample Graphs › Line Graph Examples Thefts
Further Samples:
Model 1
Fast Food Consumption
Line Graph
Model 2
Charity Spending
Pie Chart
Model 3
School Attendance
Table
Model 4
Shopping Mall
Map
Model 5
Brick Manufacturing
Process
Model 6
UK GDP
Bar Chart
Model 7
Team Scores
Bar Chart
Model 8
Electicity Generation
Pie Chart
Model 9
British Emigration
Bar Chart
Model 10
UK Visits
Line & Bar
Model 11
Car Theft
Line Graph
Model 12
Arrests
Pie & Bar
Model 13
Modes of Transport
Bar Chart
Model 14
Living Expenditure
Table
Model 15
Making Chocolate
Process
Model 16
Monthly Expenditure
Bar Chart
Model 17
Tea Manufacture
Process
Model 18
Poverty
Pie & Bar
Model 19
Borrowing Books
Line & Pie
New! Comments
Any questions or comments about this page or about IELTS?Post your comment here.