IELTS Pie and Bar Chart
This model answer is for an IELTS Pie and Bar Chart combined.For a lesson on how to write about two charts together in one question, follow this link.
Model Graph
You should spend about 20 minutes on this task.
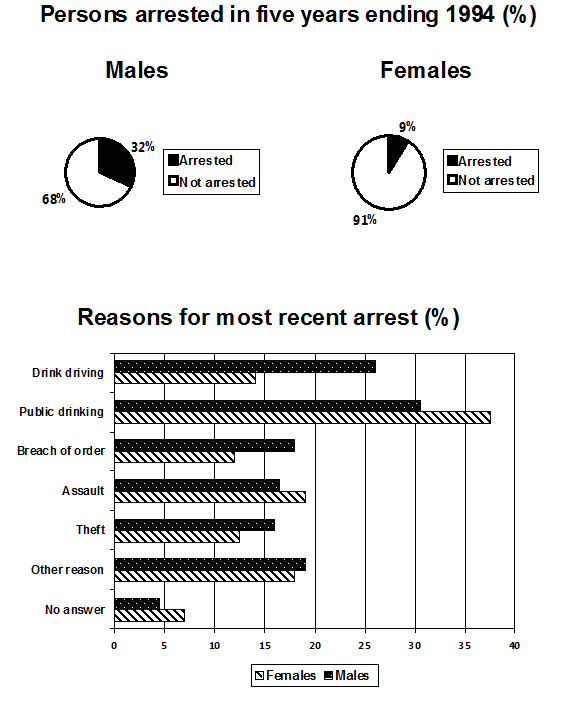
The pie chart shows the percentage of persons arrested in the five years ending 1994 and the bar chart shows the most recent reasons for arrest.
Summarize the information by selecting and reporting the main features and make comparisons where relevant.
Write at least 150 words.
IELTS Pie and Bar Chart - Model Answer
The pie chart illustrates the percentage of males and females who were arrested from 1989 to 1994, while the bar chart compares the main reasons that the different genders were arrested most recently. It is evident from the charts that males were arrested more than females and that public drinking was the most common reason for arrest for both.
To begin, the proportion of males arrested was much greater than for females. 32% were arrested compared to only 9% for women. Turning to the reasons for the most recent arrests, there were some clear differences between men and women. Men were twice as likely to be arrested for drink driving than women, at 26% and 14% respectively. Breach of order, theft, and other reasons were also slightly higher for men, with all these offences standing in the range of 12-18% for both sexes. Interestingly though, women experienced a higher percentage of arrest rates for assault and public drinking. The figures for assault were fairly similar at approximately 18%, whereas public drinking represented the main reason for arrest, with women at a massive 38%, compared to 31% for men.
(188 Words)
Home › Sample Graphs › Pie and Bar Chart Arrests
Further Samples:
Model 1
Fast Food Consumption
Line Graph
Model 2
Charity Spending
Pie Chart
Model 3
School Attendance
Table
Model 4
Shopping Mall
Map
Model 5
Brick Manufacturing
Process
Model 6
UK GDP
Bar Chart
Model 7
Team Scores
Bar Chart
Model 8
Electicity Generation
Pie Chart
Model 9
British Emigration
Bar Chart
Model 10
UK Visits
Line & Bar
Model 11
Car Theft
Line Graph
Model 12
Arrests
Pie & Bar
Model 13
Modes of Transport
Bar Chart
Model 14
Living Expenditure
Table
Model 15
Making Chocolate
Process
Model 16
Monthly Expenditure
Bar Chart
Model 17
Tea Manufacture
Process
Model 18
Poverty
Pie & Bar
Model 19
Borrowing Books
Line & Pie
New! Comments
Any questions or comments about this page or about IELTS?Post your comment here.