Sample Pie Chart - IELTS Task 1
This is a sample pie chart for IELTS task 1.
In this example, there are four pie charts that you have to compare.
Model Graph
You should spend about 20 minutes on this task.
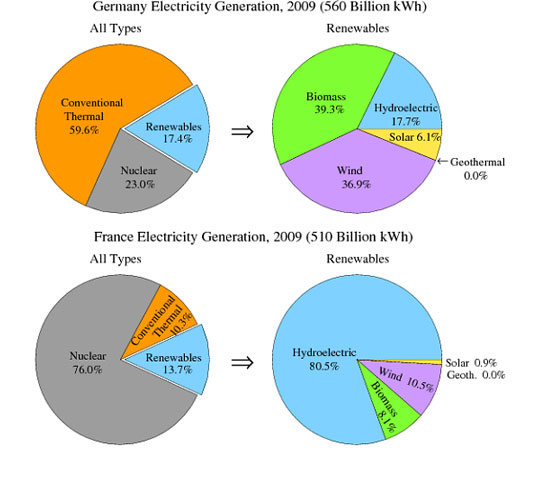
The pie charts show the electricity generated in Germany and France from all sources and renewables in the year 2009.
Summarize the information by selecting and reporting the main features and make comparisons where relevant.
Write at least 150 words.
Sample Pie Chart - Model Answer
The four pie charts compare the electricity generated between Germany and France during 2009, and it is measured in billions kWh. Overall, it can be seen that conventional thermal was the main source of electricity in Germany, whereas nuclear was the main source in France.
The bulk of electricity in Germany, whose total output was 560 billion kWh, came from conventional thermal, at 59.6%. In France, the total output was lower, at 510 billion kWh, and in contrast to Germany, conventional thermal accounted for just 10.3%, with most electricity coming from nuclear power (76%). In Germany, the proportion of nuclear power generated electricity was only one fifth of the total.
Moving on to renewables, this accounted for quite similar proportions for both countries, ranging from around 14% to 17% of the total electricity generated. In detail, in Germany, most of the renewables consisted of wind and biomass, totaling around 75%, which was far higher than for hydroelectric (17.7%) and solar (6.1%). The situation was very different in France, where hydroelectric made up 80.5% of renewable electricity, with biomass, wind and solar making up the remaining 20%. Neither country used geothermal energy.
191 Words
Home › Sample Graphs › Sample Pie Chart
Further Samples:
Model 1
Fast Food Consumption
Line Graph
Model 2
Charity Spending
Pie Chart
Model 3
School Attendance
Table
Model 4
Shopping Mall
Map
Model 5
Brick Manufacturing
Process
Model 6
UK GDP
Bar Chart
Model 7
Team Scores
Bar Chart
Model 8
Electicity Generation
Pie Chart
Model 9
British Emigration
Bar Chart
Model 10
UK Visits
Line & Bar
Model 11
Car Theft
Line Graph
Model 12
Arrests
Pie & Bar
Model 13
Modes of Transport
Bar Chart
Model 14
Living Expenditure
Table
Model 15
Making Chocolate
Process
Model 16
Monthly Expenditure
Bar Chart
Model 17
Tea Manufacture
Process
Model 18
Poverty
Pie & Bar
Model 19
Borrowing Books
Line & Pie
New! Comments
Any questions or comments about this page or about IELTS?Post your comment here.