IELTS Sample Bar Chart
On this page you will find a model answer for an IELTS bar chart.
This chart is over time, so it uses the 'language of change'.
Have a look at this lesson for more advice on describing a bar graph over time.
Gross Domestic Product in the UK
You should spend about 20 minutes on this task.
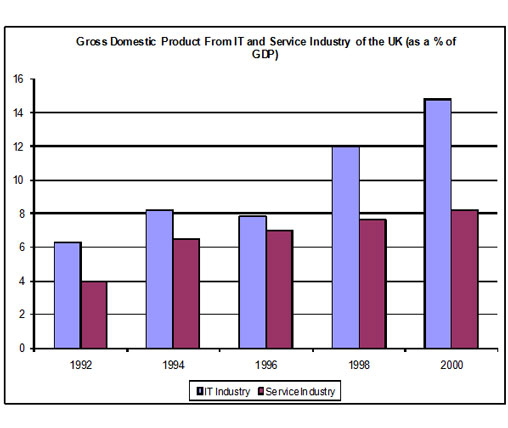
The chart shows components of GDP in the UK from 1992 to 2000.
Summarize the information by selecting and reporting the main features and make comparisons where relevant.
Write at least 150 words.
Model Answer
The bar chart illustrates the gross domestic product generated from the IT and Service Industry in the UK from 1992 to 2000. It is measured in percentages. Overall, it can be seen that both increased as a percentage of GDP, but IT remained at a higher rate throughout this time.
At the beginning of the period, in 1992, the Service Industry accounted for 4 per cent of GDP, whereas IT exceeded this, at just over 6 per cent. Over the next four years, the levels became more similar, with both components standing between 6 and just over 8 per cent. IT was still higher overall, though it dropped slightly from 1994 to 1996.
However, over the following four years, the patterns of the two components were noticeably different. The percentage of GDP from IT increased quite sharply to 12 in 1998 and then nearly 15 in 2000, while the Service Industry stayed nearly the same, increasing to only 8 per cent.
At the end of the period, the percentage of GDP from IT was almost twice that of the Service Industry.
Words 182
Comments
This answer meets the requirements of the task.
The introduction explains what the graph is about, and gives an overview of the main points.
The body paragraphs are ordered logically and clearly. The first body paragraph discusses the first three years, where the patterns are fairly similar. This is contrasted in the second body paragraph, where the GDP of each country diverges noticably.
There are a wide variety of sentence structures and the language of change is correctly used. The correct tense - the past - is used.
Next >>>
Home › Sample Graphs › Sample Bar Chart
Further Samples:
Model 1
Fast Food Consumption
Line Graph
Model 2
Charity Spending
Pie Chart
Model 3
School Attendance
Table
Model 4
Shopping Mall
Map
Model 5
Brick Manufacturing
Process
Model 6
UK GDP
Bar Chart
Model 7
Team Scores
Bar Chart
Model 8
Electicity Generation
Pie Chart
Model 9
British Emigration
Bar Chart
Model 10
UK Visits
Line & Bar
Model 11
Car Theft
Line Graph
Model 12
Arrests
Pie & Bar
Model 13
Modes of Transport
Bar Chart
Model 14
Living Expenditure
Table
Model 15
Making Chocolate
Process
Model 16
Monthly Expenditure
Bar Chart
Model 17
Tea Manufacture
Process
Model 18
Poverty
Pie & Bar
Model 19
Borrowing Books
Line & Pie
New! Comments
Any questions or comments about this page or about IELTS?Post your comment here.