IELTS Line and Bar Chart
This is an example of two graphs together - a line and bar chart.
View this lesson for tips and advice on how to describe two graphs together, using the example from this page.
You should spend about 20 minutes on this task.
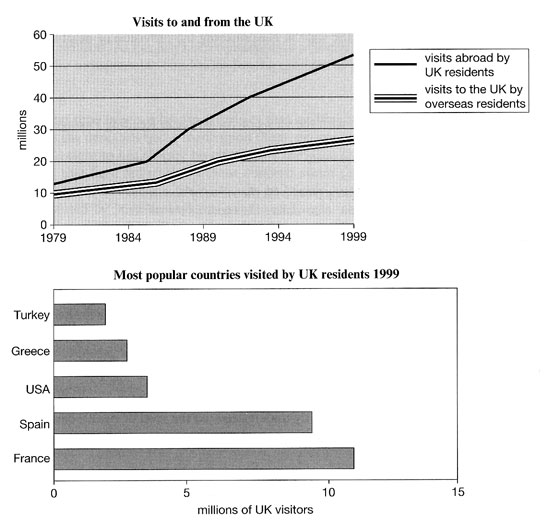
The line graph shows visits to and from the UK from 1979 to 1999, and the bar graph shows the most popular countries visited by UK residents in 1999.
Summarize the information by selecting and reporting the main features and make comparisons where relevant.
Write at least 150 words.
IELTS Line and Bar Chart - Model Answer
The line graph illustrates the number of visitors in millions from the UK who went abroad and those that came to the UK between 1979 and 1999, while the bar chart shows which countries were the most popular for UK residents to visit in 1999. Overall, it can be seen that visits to and from the UK increased, and that France was the most popular country to go to.
To begin, the number of visits abroad by UK residents was higher than for those that came to the UK, and this remained so throughout the period. The figures started at a similar amount, around 10 million, but visits abroad increased significantly to over 50 million, whereas the number of overseas residents rose steadily to reach just under 30 million.
By far the most popular countries to visit in 1999 were France at approximately 11 million visitors, followed by Spain at 9 million. The USA, Greece, and Turkey were far less popular at around 4, 3 and 2 million visitors respectively.
(Words 171)
Home › Sample Graphs › Line and Bar Chart Visiting UK
Further Samples:
Model 1
Fast Food Consumption
Line Graph
Model 2
Charity Spending
Pie Chart
Model 3
School Attendance
Table
Model 4
Shopping Mall
Map
Model 5
Brick Manufacturing
Process
Model 6
UK GDP
Bar Chart
Model 7
Team Scores
Bar Chart
Model 8
Electicity Generation
Pie Chart
Model 9
British Emigration
Bar Chart
Model 10
UK Visits
Line & Bar
Model 11
Car Theft
Line Graph
Model 12
Arrests
Pie & Bar
Model 13
Modes of Transport
Bar Chart
Model 14
Living Expenditure
Table
Model 15
Making Chocolate
Process
Model 16
Monthly Expenditure
Bar Chart
Model 17
Tea Manufacture
Process
Model 18
Poverty
Pie & Bar
Model 19
Borrowing Books
Line & Pie
New! Comments
Any questions or comments about this page or about IELTS?Post your comment here.