Sample IELTS Bar Graph
Here is an IELTS sample bar graph on the topic of British emigration.
This chart is over time, so it uses the language of change as well as language of comparison and contrast.
IELTS Writing Task 1 - Example 9
You should spend about 20 minutes on this task.
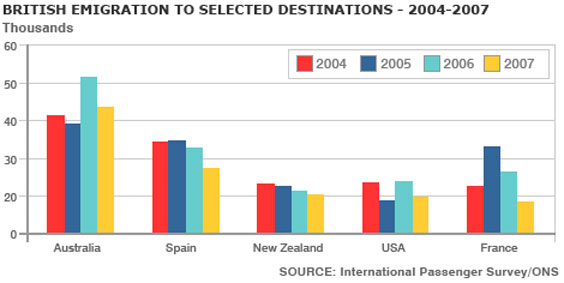
The chart shows British Emigration to selected destinations between 2004 and 2007.
Summarize the information by selecting and reporting the main features and make comparisons where relevant.
Write at least 150 words.
IELTS Bar Chart Model Answer
The bar chart shows the number of British people who emigrated to five destinations over the period 2004 to 2007. It is evident from the chart that throughout the period, the most popular place to move to was Australia.
Emigration to Australia stood at just over 40,000 people in 2004, which was approximately 6,000 higher than for Spain, and twice as high as the other three countries. Apart from a jump to around 52,000 in 2006, it remained around this level throughout the period.
The next most popular country for Britons to move to was Spain, though its popularity declined over the time frame to finish at below 30,000 in 2007. Despite this, the figure was still higher than for the remaining three countries. Approximately 20,000 people emigrated to New Zealand each year, while the USA fluctuated between 20-25,000 people over the period.
Although the number of visitors to France spiked to nearly 35,000 in 2005, it was the country that was the least popular to emigrate to at the end of the period, at just under 20,000 people.
(Words 179)
Next >>>
Home › Sample Graphs › Sample IELTS Bar Graph
Further Samples:
Model 1
Fast Food Consumption
Line Graph
Model 2
Charity Spending
Pie Chart
Model 3
School Attendance
Table
Model 4
Shopping Mall
Map
Model 5
Brick Manufacturing
Process
Model 6
UK GDP
Bar Chart
Model 7
Team Scores
Bar Chart
Model 8
Electicity Generation
Pie Chart
Model 9
British Emigration
Bar Chart
Model 10
UK Visits
Line & Bar
Model 11
Car Theft
Line Graph
Model 12
Arrests
Pie & Bar
Model 13
Modes of Transport
Bar Chart
Model 14
Living Expenditure
Table
Model 15
Making Chocolate
Process
Model 16
Monthly Expenditure
Bar Chart
Model 17
Tea Manufacture
Process
Model 18
Poverty
Pie & Bar
Model 19
Borrowing Books
Line & Pie
New! Comments
Any questions or comments about this page or about IELTS?Post your comment here.