Bar Chart Exercise
Lesson 6
This bar chart exercise is a gap fill to give you pratice with the language of comparison, contrast and percentages.
Look at the graph and then read the model answer.
Choose the right word to go in the gap.
Bar Chart Exercise - Gap Fill
You should spend about 20 minutes on this task.
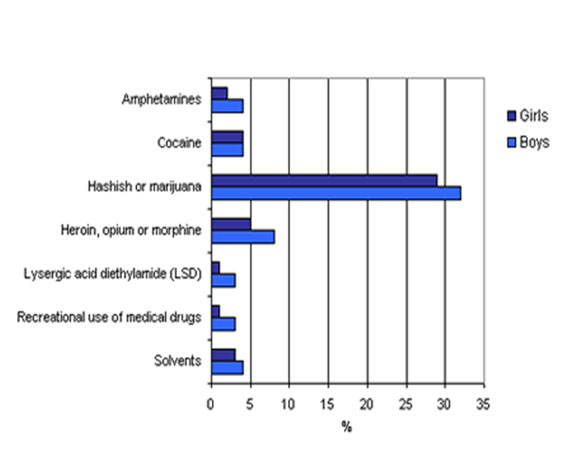
The chart shows the percentage of drugs taken by girls and boys in a school in New Zealand.
Summarize the information by selecting and reporting the main features and make comparisons where relevant.
Write at least 150 words.
Place the right word into the space. Make sure you write (or copy and paste) the word exactly as it appears in the box, otherwise it will get marked as wrong.
Don't look below the exercise otherwise you will see an answer key.
at approximately 8% / the least /
school children / are similar / gender /
in percentages / more than / equal /
at the same level / percentages for /
at only 5% / around 33% / is exactly /
4% for / bar chart illustrates
Bar Chart Exercise - Answer
The 1. bar chart illustrates information on the quantity of drugs 2. school children in New Zealand take, divided by 3. gender and measured 4. in percentages. Overall, it is immediately apparent that hashish or marijuana is used 5. more than any of the other drugs, whereas LSD is used 6. the least. At first glance we can see that boys take more drugs than girls for 6 out of 7 of the drugs listed, however an 7. equal number of boys and girls take cocaine.
To begin with, boys use more hashish or marijuana than girls at 8. around 33% and 29% respectively. Following this, boys take heroin, opium or morphine 9. at approximately 8%, but girls 10. at only 5%.
On the other hand, the 11. percentages for amphetamines and solvents 12. are similar for both boys and girls at 2% and 3% for girls and 13. 4% for both drugs for boys. Next, the pattern for LSD and medical drugs 14. is exactly the same for both genders at 1% for girls and 3% for boys. Finally, boys and girls take cocaine 15. at the same level, 4%.
Home › IELTS Lessons › Bar Chart Exercise
Writing Task 1 (Academic)
Lesson 1:
Describing a Graph Over Time
Lesson 2:
Describing an IELTS Pie Chart
Lesson 3:
Describing an IELTS Process
Lesson 4:
Describing two graphs together
Lesson 5:
Common Language of Change
Lesson 6:
Gap Fill - Bar Chart
Lesson 7:
Gap Fill - Line Graph
Lesson 8:
Common Language to Compare and Contrast
Lesson 9:
A Common Mistake
Lesson 10:
Describing Tables
Lesson 11:
Organizing your answer
Lesson 12:
Gap Fill - Table
Lesson 13:
Using Prepositions
Lesson 14:
Describing the future
Lesson 15:
Gap Fill - Pie Chart
Writing Task 1 (GT)
Lesson 1:
Opening and Closing a Letter
New! Comments
Any questions or comments about this page or about IELTS?Post your comment here.