IELTS Bar Chart - Science Qualifications
by Nicolo
(Sardinia)

Science Qualification in Two Countries
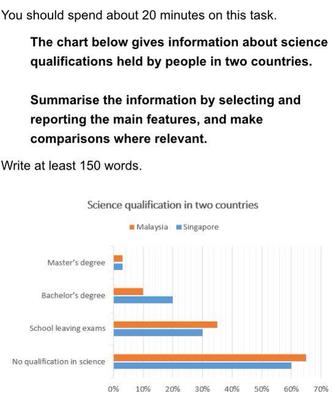
The bar chart illustrates the percentage of science qualifications in Malaysia and Singapore. On the x-axis there are 4 types of qualifications in science, which are as follow: Master's Degree, Bachelor's Degree, School leaving exams and no qualification.
Overall, it can be noticed that in both countries science qualifications hold by people increased.
The percentage of people who held no qualification in Malaysia and Singapore is 65% and 60% respectively. A significant decrease is evident comparing school leaving exams (Singaporinians 30% and about 35% for Malaysians) to no qualification in the same countries. A low percentage of Bachelor's Degree and Master's Degree Is shown in the graph. In Singapore the percentage of people who held a Bachelor is 20%, instead in Malaysia it is the half, that means 10%. On the other hand, the number of Master's Degree gotten are steadily at about 5% both in Malaysia and Singapore. Finally, more than a half of people held no qualification in science.
What score do you think this IELTS bar chart on Science Qualifications in Two Countries would get?
Let the writer know in the comments below and please provide any other useful feedback.
Comments for IELTS Bar Chart - Science Qualifications
|
||
|
||
|
||
|
||