IELTS Table - Consumer Spending on Different Items
by Spark

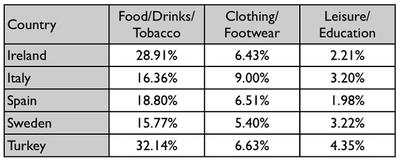
The table gives information on consumer spending on different items in five different countries in 2002
Hi,
I really need a band 7. Can you please tell me if its good enough for me to sit the exam. I will really appreciate your answer :)
The table statistically illustrates the proportion of people's expenses for various items in different countries of Europe i.e Ireland, Spain, Sweden and Turkey in the year 2002. It can be clearly seen that the national consumer expenditure on food items and education is highest in Turkey and lowest in Sweden and Spain respectively.
All of these countries prefer spending most of their income on edibles, drinks and on smoking. A moderate amount is spent on clothing and footwear articles while an even lesser amount is spent on recreational activities and education.
Food, drinks and tobacco consumption is 32.14% in Turkey which is twice the amount spent by Italy (16.36%), and is followed by Ireland with a 28.91% expenditure. Spain and Sweden are relatively close to Italy with 18.80% and 15.77% respectively.
Italy's consumer expenditure on clothing is 9% while it is quite less in the other countries.
Recreational activities and education are comparatively considered important in Italy (4.35%) with the trend decreasing to almost 2% in Spain.
After analyzing these facts, it can be concluded that people of Turkey are most concerned about their health and education while Italy invests most on fashion industry.
Comments for IELTS Table - Consumer Spending on Different Items
|
||
|
||
|
||
|
||