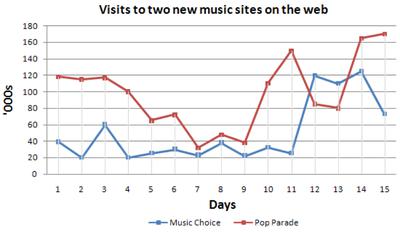
IELTS Line Graph - Number of Visits to Two New Music Sites
by Adalberto Ferrari
(Italy)

The graph below compares the number of visits to two new music sites on the web. Write a report for a university lecturer describing the information shown below. You should write at least 150 words.
The line graph shows the amount of visits received by two music websites, Music Choice and Pop Parade, in a period of 15 days.
Overall, it is clear that the most visited website is Pop Parade, but for few days the trend was switched.
Going to detail, Pop Parade visits at day 1 accounted as 120k, much higher than Music Choice, with only a third of the visits (40k).
At day 3, Pop Parade registered a steady decline in visits, but still more than the ones received by Music Choice, which reached a peak of 60k visits.
Pop Parade continued its erratic decrease until day 11, when a sharp growth reached more than 140k visits; in the same period, visits for Music Choice fluctuated between 20k and 40k views.
After day 11, Pop Parade’s popularity fell to 80k visits for two days, whereas Music Choice resulted to be the most favourite website.
Finally, from day 13 to day 15, Music Choice plunged to reach nearly 70k views; on the contrary, Pop Charts suddenly rose to reach just over 160k visits, continuing a constant increase at day 15.
(words: 187)
You can provide feedback on this graph about the number of visits to two new music sites on the web and help the candidate improve their score by clicking the comments link below.
Return to IELTS Graph Feedback Forum.