IELTS Line Graph - Dubai Gold Sales

by Dafah Ahmad
(Depok, West Java, Indonesia)
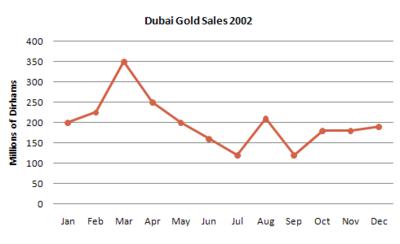
The line graph shows estimated sales of gold in Dubai for 12 months in 2002 in millions of Dirhams

The line graph shows estimated sales of gold in Dubai for 12 months in 2002 in millions of Dirhams

The line graph gives information about gold trade in Dubai from January to December of the year 2002.

It is clear in the graph that the gold sales reached its highest level of selling in March and it fell to its lowest level between July and September.

In the beginning of the year the gold price stood at 200 millions of dirhams and it increased slightly in the following month before the figures showed a sharp rise in March, with the selling was about 350 million of dirhams.

In contrast, after the trend reached a peak in March with its highest gold trading, the figures decreased gradually for the next 4 months from April, May, June and July with 250, 200, 150, and 120 million of dirhams, respectively. Surprisingly enough, there was a strong recovery for the Dubai gold sales in August with the selling was about 200 million of dirhams and it fluctuated before it was levelling off until the end of the year and the trading closed nearly 200 million of dirhams in December.

***


Please can someone give me feedback on my line graph about Dubai Gold Sales. Thanks.

Comments for IELTS Line Graph - Dubai Gold Sales

Average Rating starstarstarstarstar

Click here to add your own comments

Oct 05, 2016
Rating
starstarstarstarstar
Good one
by: Anonymous

Good write up...

Oct 06, 2016
Rating
starstarstarstarstar
IELTS Line Graph - Dubai Gold Sales
by: Anonymous

The line chart gives an information about the amount of gold selling in Dubai, between January and December in 2002, measured in millions of Dirhams.Overall, the trade gold fluctuates in price from rose and declined again to the starting level.

First of all, In January the price was 200 million of Dirhams, the price dramatically went up to higher levels in March (350 million of Dirhams)

In contrast, over four months from March to July the gold value suddenly decreased from 350 million of Dirhams to just over one hundred million of Dirhams then increased to close to 200 million of Dirhams in August.The price of gold dropped again approximately 100 million of Dirhams in September. In October and November, the price of gold remains stable just under 200 million of Dirhams. Finally, the price of gold returned to begging value roughly 200 million of Dirhams.

Dec 22, 2016
Rating
starstarstarstarstar
explained very well
by: Anonymous

it is very clear and explained very well

Click here to add your own comments

Return to IELTS Graph Feedback Forum.