IELTS Bar Chart - Oil Production Capacity
by Kimsiang Lim

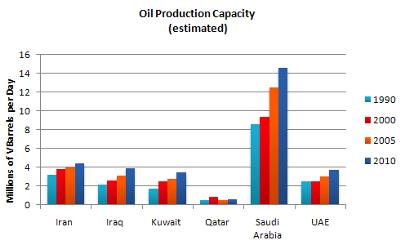
The bar chart shows the oil production capacity of six different countries between 1990 and 2010
The bar chart illustrates the capacity of oil production in millions of barrels per day for 6 Gulf nations over a 20-year-period.
It can be seen that the oil production capacity increased in all of the countries over the period mentioned. However, the most dramatic rise was seen in Saudi Arabia.
In 1990, most of the countries produced two to three millions barrels of oil per day, except Saudi Arabia and Qatar, which produced 8 millions of barrels per day and less than 1 million of barrels per day. By the year 2000, Saudi Arabia was still in the lead in oil production capacity of 9 millions of barrels per day, while the UAE' oil production capacity remained stable of 3 millions barrels per day.
All of the countries' oil production capacity increased gradually, except Qatar, which oil production capacity dropped to barely 1 million barrels per day again. Whereas, Saudi Arabia's capacity of oil production rose dramatically to nearly 15 millions barrels per day in 2010.
You can feedback on this IELTS Bar Chart about Oil Production Capacity by following the link below.
Return to IELTS Graph Feedback Forum.