IELTS Bar Chart - Computer Ownership
by novita
(indonesia)

The graphs above give information about computer ownership as a percentage of the population between 2002 and 2010, and by level of education for the years 2002 and 2010.
Hi, may i please have a feedback on my ielts writing below? any suggestion is a huge help. thank you.
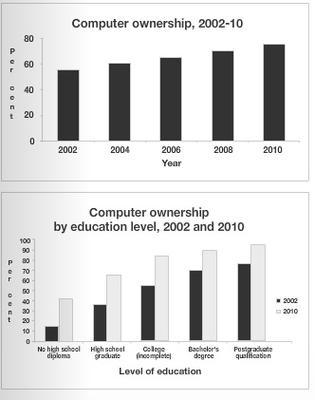
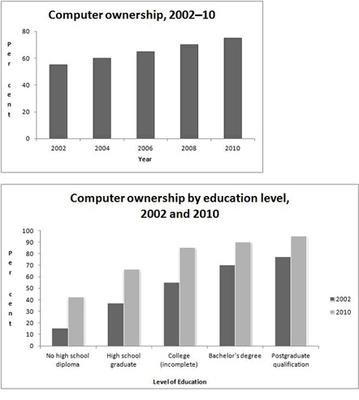
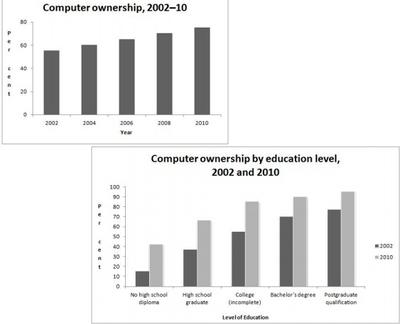
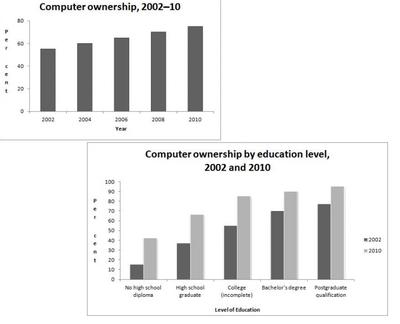
Computer ownership increases significantly from the year 2002 until 2010. The graph shows in the beginning, roughly sixty - percent of the population owns a computer. By the year 2010 this number has almost double in size with an eighty-percent of the population then owns a computer. The graph also shows that there is a constant positive trend of computer ownership during those years leaving only twenty- percent of the population which does not yet own a computer by the end of 2010.
The education level of the population also affects the number of computer ownership. The later the year, the more people goes to school, the more graduates are emerged, hence the higher they are at their level of education. From the graph, a population with a higher level of education tends to own more computers than the slightly less educated population. However, the increase of computer ownership over the years is particularly evident accross all range of education regardless the education level.
Comments for IELTS Bar Chart - Computer Ownership
|
||
|
||
IELTS Computer Ownership Graph
by Khuntheng Puthirithea
(Siem Reap, Cambodia)

computer ownership IELTS graph
Initially, I have lacked acquirement of writing and now I am getting my hands dirty on this operation day by day. Therefore, befall, I decide to send one of my practice through the site in order to receive feedback.
Finally, I am looking forward to receiving feedback from the site.
Thanks in advance!
The graphs above give information about computer ownership as a percentage of the population between 2002 and 2010, and by level of education for the years 2002 and 2010.
Summarise the information by selecting and reporting the main features, and make comparisons where relevant.
Write at least 150 words.
The bar graphs provide data of computer ownership as percentage of population from 2002 to 2010 and by various level of education in the years 2002 and 2010.
According to the first graph, it illustrates that in 2002 there were approximately 56% of people who owned computer and it rose gradually from around 56% in 2002 to well-over 60% in 2008.Furthermore , it increased very slowly and reached its peak in 2010 from well-over 60% to considerably 74%.
Base on the following figure , in 2002 it indicates that there were about 13% of computer users who had no high school diploma and this was triply less than students who had completely graduated from high school whose proportion was hovering 30% of computer users. Meanwhile,in 2002, the proportion of postgraduate qualifiers was the maximum, which was approximately 75%;followed by Bachelor's degree qualifiers and incomplete college students: around 70% and slightly under 60%,respectively.However, it is suggested that the in 2010 these groups maintained very similar around 85% to 95% of users as the postgrauate qualifiers still were the most users like they were in 2002.
Overall, there were an increasingly onward of computer owners from 2002 to 2010; while 5 different level of students ,their computer using rates altered significantly and increasingly in 2002 and 2010.
Comments for IELTS Computer Ownership Graph
|
||
|
||
|
||
Bar Chart - Computer Ownership and Level of Education
by rifa
(Indonesia)

The graphs give information about computer ownership as a percentage of the population between 2002 and 2010, and by level of education for the years 2002 and 2010
The charts show computer ownership from 2002 – 2010 and computer ownership by education level in 2002 and 2010. Generally, there were increased number of ownership from 2002 to 2010 and the percentage were higher along with higher education level.
From the first chart, the ownership of computer were between about 50% to 70%. Its percentage is increased slightly every two years and reached its peak in 2010 which more than 60%.
The second chart shows above 10% people without high school diploma in 2002 owned computer. The biggest percentage at the same year is in postgraduate qualification which almost 80%. Furthermore, computer ownership in each level education increased from 2002 and 2010. The difference between these two years were quite the same in three education level; no high school diploma, high school graduate, and college which 30% higher. On the other hand, the difference in bachelor and postgraduate degree were only about 20%.
You can give comment's on this student's response to this Task 1 below.
Return to IELTS Graph Feedback Forum.
IELTS Graph - Computer ownership
by Liza
(Moscow)

Computer ownership as a percentage of the population
Hello everyone,
here's an IELTS Academic Writing 1 assignment I have written today. I would really appreciate if anyone could comment on this and especially tell me whether it could be given a good mark (6.5 or higher)? Thank you in advance!
(test from the site of British Council)
The graphs below give information about computer ownership as a percentage of the
population between 2002 and 2010, and by level of education for the years 2002 and
2010.
Summarise the information by selecting and reporting the main features, and make
comparisons where relevant.
------------------------------------------------------------------------
The 2 bar graphs illustrate the data about how many people owned a computer in years 2002-2010, as well as illustrating the correlation between owning a computer and having a certain level of education.
According to the data, there had been a steady rise in the amount of computer owners over the period of eight years. It went up from just 55% (that is, roughly a half) of the total population to 75% in 2010, that is, rose by 20%.
As for the educational level of computer owners, here the changes seem to be more dramatic. 5 different levels had been taken into account, from those with no high school diploma to those having a postgraduate qualifications. While in the year 2002 only 15% of the first had a computer, the percentage had tripled by the year 2008, reaching 45%. Those with a postgraduate degree in both 2002 and 2008 accounted for the highest percent of computer ownership, but the difference between the two years is less impressive, as it went from 75% to 95%, thus covering almost all people with such a degree. Computers also gained popularity among the rest of the population, namely those who had completed high school, college and those with a bachelors degree. With each of those levels computer ownership increases in both 2002 and 2010.
To sum up up, there are several trends to be mentioned. Along with a steady growth of computer ownership among the population, there is a link between owning a computer and having a particular educational level as the higher the latter is among those people whose data had been collected, the more probable it is that they have a computer.
Return to IELTS Graph Feedback Forum.