IELTS Bar and Pie Chart - Reasons for Study and Costs
by Aleyna Arzu
(Turkey)

The charts below show the result of a survey of adult education. The first chart shows the reason why adults decide to study. The pie chart shows how people think the costs of adult education should be shared.
Summarize the information by selecting and reporting the main features and make comparisons where relevant.
The charts illustrate the results of a survey of adult education.
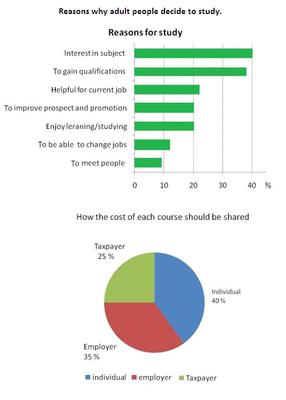
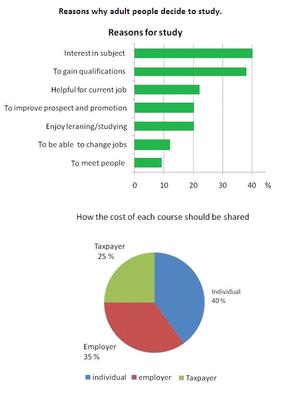
As it can be seen from the table below, the main reason for adult education is interest in subject that accounts for 40% of the rest factors. Approximately 38% of the participants represent gaining qualifications as the most second important reason. Adult education appears to be useful for present jobs of 22% of the people participating in the survey. The other reason is to enhance the possibility of getting higher positions in work and to enjoy learning that constitute 20% for each. For 12% it is preferable to continue education, as it can create opportunities for shifting jobs. Just 9% are interested in meeting new friends through adult education.
When it comes to pie chart, it shows sharing the costs of adult education. According to the pie chart, individual presides over the rests with 40%. Employer accounts for 35%, while taxpayer 25%.
Comments for IELTS Bar and Pie Chart - Reasons for Study and Costs
|
||
|
||
|
||
IELTS Graph - Reason for Study and Sharing of Costs
by uzma abbas
(lahore)

The charts show the result of a survey of adult education. The first chart shows the reason why adults decide to study. The pie chart shows how people think the costs of adult education should be shared
The bar chart illustrates the proportions of the decisional views regarding indications for education among young individuals and the pie chart represents the supposed budget allocation of each educational course on individual basis. At the first glance, it can be seen that major reason for adult education is interest in subjects (40%) and the very same proportion should be shared by individuals for each course.
To begin, the bar chart shows that around 38-40% of adults decide to study to gain qualifications and due to interest in subjects respectively. While according to 20-22% of people, they find the adult education necessary to enjoy learning, to improve promotional prospects and to find it helpful for the current job respectively. Very small proportion of adults is with the views to meet people and for changing job purposes.
By far, the pie chart shows that 40% of the educational course cost should be the responsibility of individuals, 35 % should be paid by employers and about a quarter should be allocated to taxpayers.
You can feedback below on this IELTS Graph about the Reason for Study and Sharing of Costs.
Comments for IELTS Graph - Reason for Study and Sharing of Costs
|
||
|
||
|
||
|
||
|
||